How We Used Lovable + Cursor + Momen to Build Our Social Metrics Tool
Intro
When running multiple marketing campaigns, it's easy to lose track of what’s actually working. We used to collect content metrics manually across different platforms, but it quickly got messy and hard to compare. So we decided to build our own internal dashboard—simple, visual, and tailored to how we work. In this post, I’ll share how we used Lovable, Cursor, and Momen to build our content metrics dashboard—no code (or at least, very little) needed.
A quick walkthrough video:
The Problem: Too Many Links, Not Enough Insights
Our old setup was just a basic workflow: an RPA script grabbed data from a list of predefined links and sent the views or engagement numbers to our team chat. We could only add or remove links—no filtering, no charts, no comparisons. We had the data, but no way to visualize it or actually use it to make decisions.
That’s when we thought: why not build a proper dashboard ourselves—with Momen?
The Stack: Lovable, Cursor, and Momen
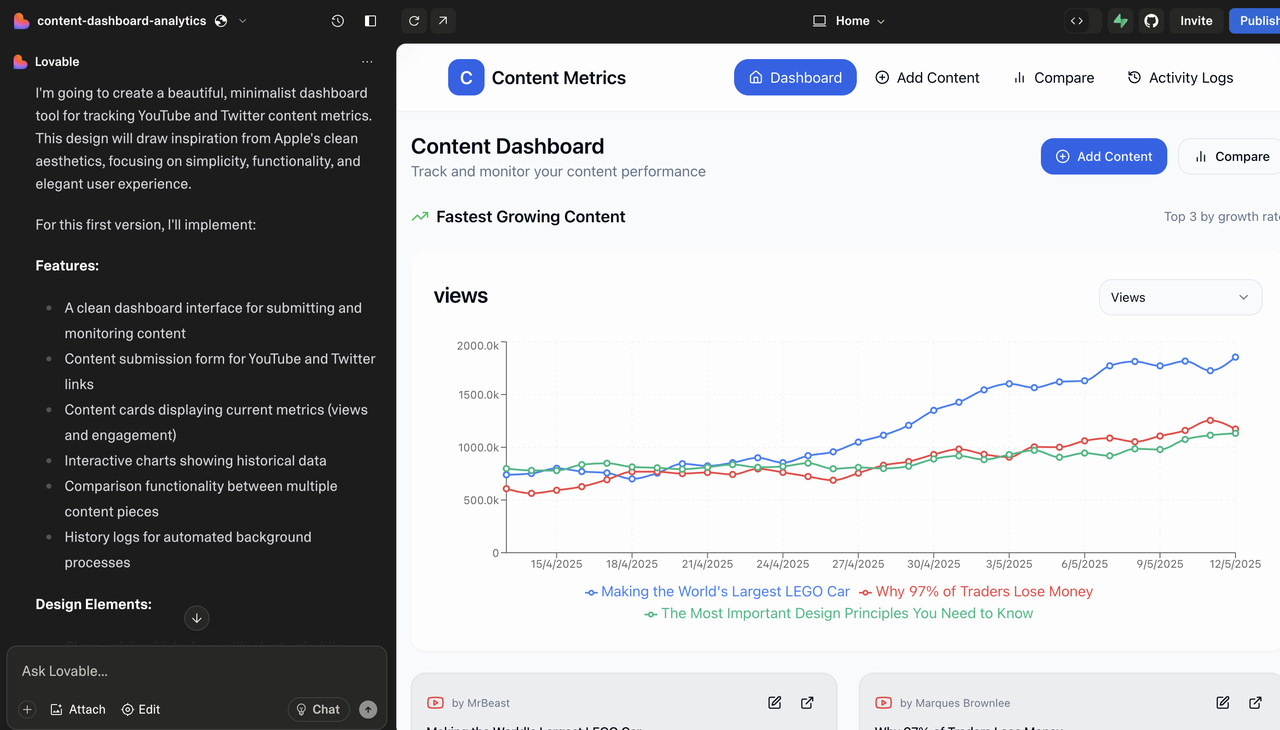
Starting with Lovable: Getting a Head Start
Since it was an internal tool, we didn’t want to pour tons of resources into it. Our marketing engineer wrote up a PRD and dropped it into Lovable—and it generated a surprisingly complete, polished UI.
One thing we learned: before prompting Lovable, organize your thoughts. Think through what pages you’ll need, what each part of the app should do, and what kind of data will be involved. You can even ask ChatGPT to help format your brief. Feeding a well-structured prompt into Lovable gets much better results than just winging it.
Some tips we found when using Lovable:
Before typing the prompt, figure out the requirement in a structured way, for example, the pages, functions, what data will be involved, etc. You can also type your requirements to ChatGPT and ask it to structure for you. Then input the answer to Lovable, the output could be much more accurate and closer to your expectation.
Once we had the UI, we exported it into a design sketch(using Figma plugins) and started building the actual product in Momen.
Adding Charts with Cursor
We wanted a dashboard feel, so charts were essential. Momen supports code components, so we used Cursor to help us write the React components for charts and embedded them in our app. No one on our marketing team codes regularly, but Cursor helped bridge that gap without needing us to build from scratch.
Why Momen Was the Right Foundation (vs. Lovable or Cursor)
While Lovable was great for generating initial layouts and Cursor was helpful for writing code snippets, neither was designed for long-term, structured app building—especially for non-coders.
Lovable can generate full apps, but debugging or adjusting things later without technical knowledge is tough. Bugs can cascade, and fixing them often requires more AI tokens or manual effort than expected.
Cursor assumes you’re comfortable working with files, frameworks, and logic—even if it helps along the way, you still need a developer’s mindset to fully manage your app.
That’s why we chose to build the full app in Momen—our no-code web app builder—where we could keep control of structure, scale, and data without relying entirely on AI-generated code.
Here’s how Momen helped us build a working internal tool:
Automated workflows: We set up backend logic to fetch and update data automatically.
Structured backend: We modeled the database exactly how we needed, with flexible schemas and clean data flows.
Frontend freedom: With built-in code components, we embedded custom charts directly into the app. This hybrid no-code + code setup let us use AI-generated code (from Cursor) within a stable no-code environment.
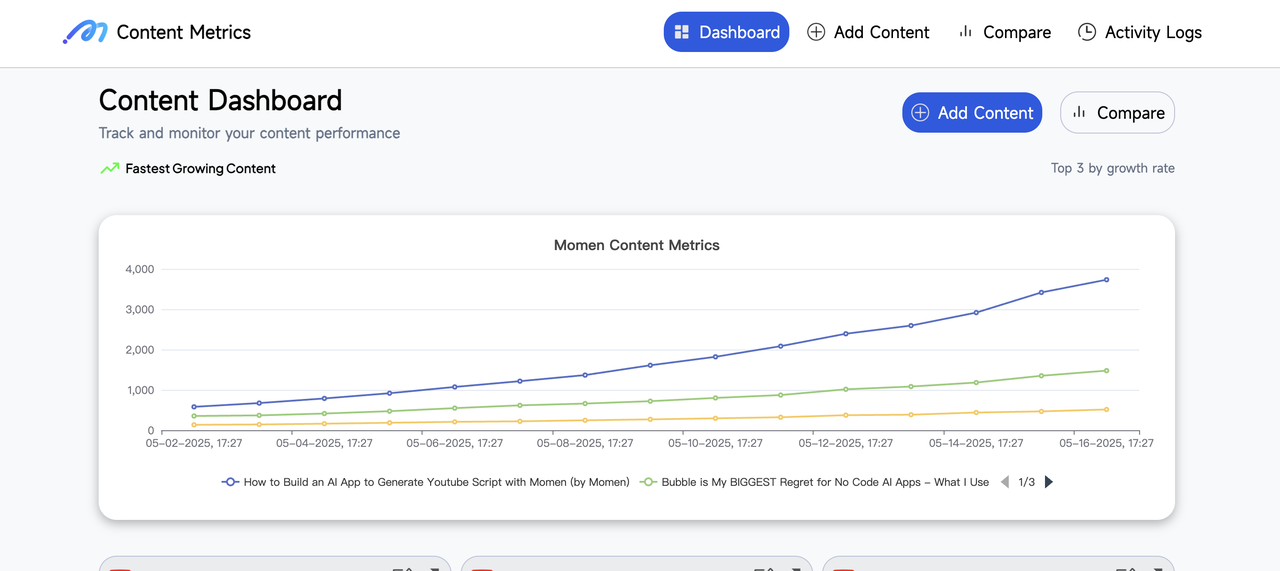
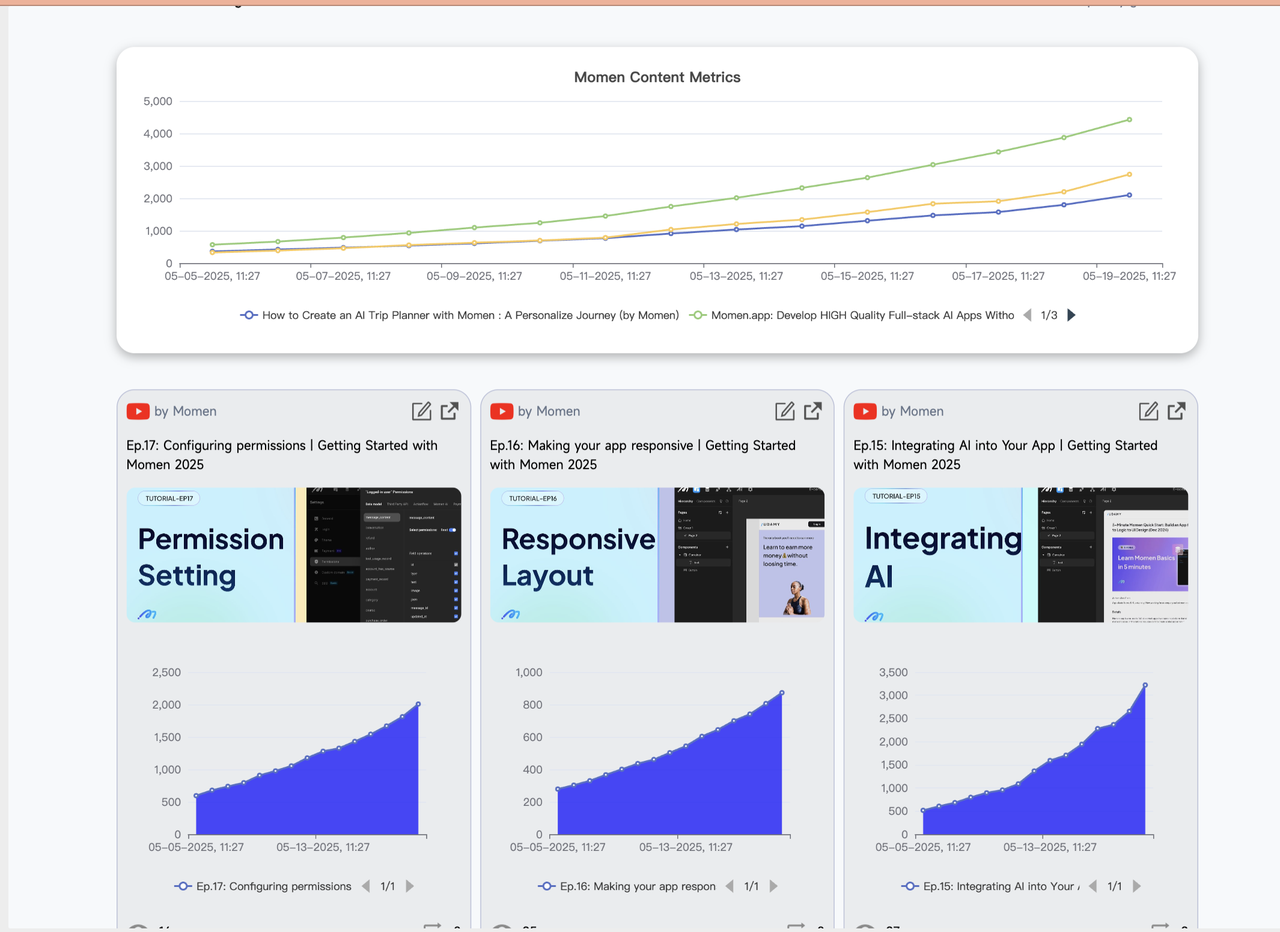
A Deep Dive into Our Content Metric Dashboard
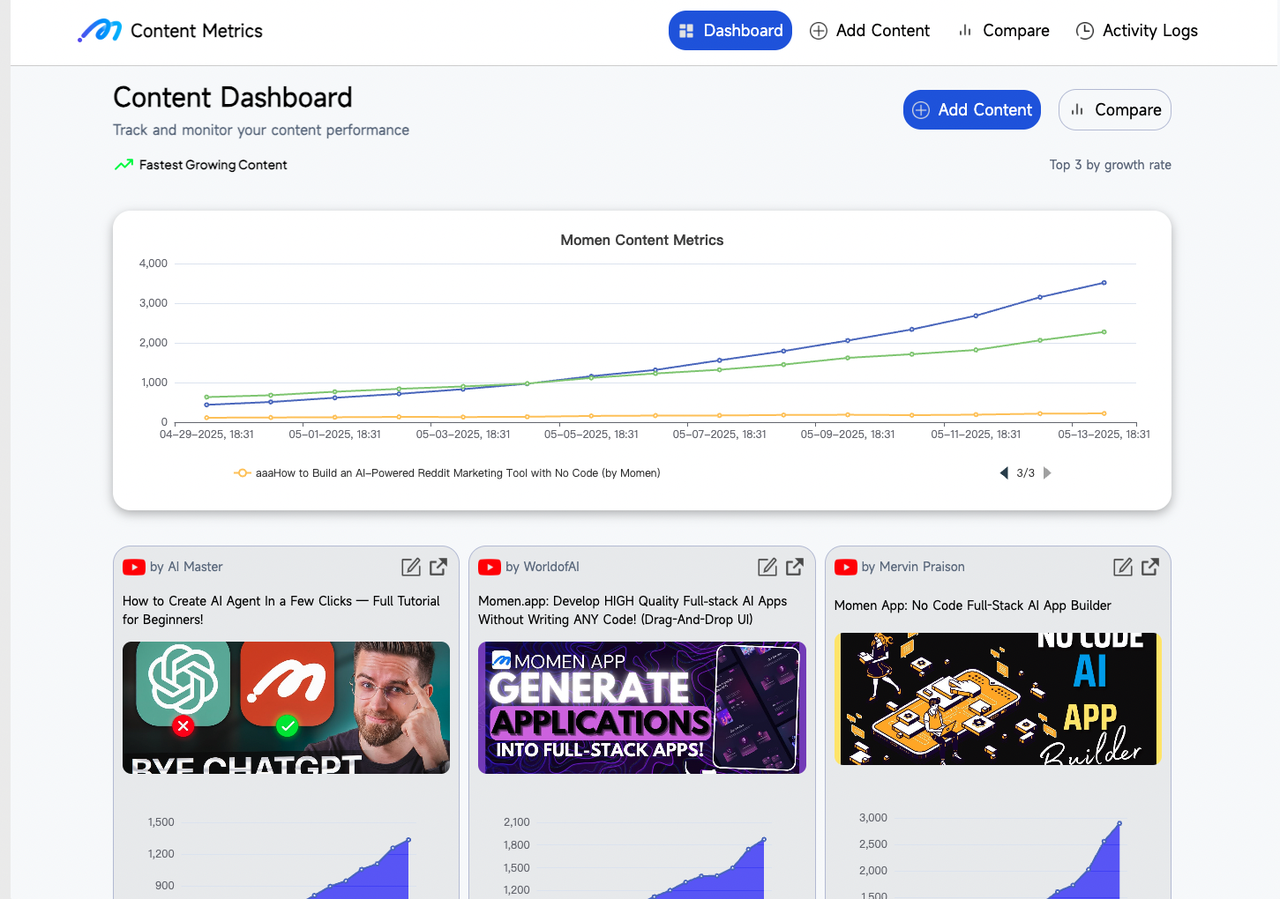
Core Features and Main Functions
App Features:
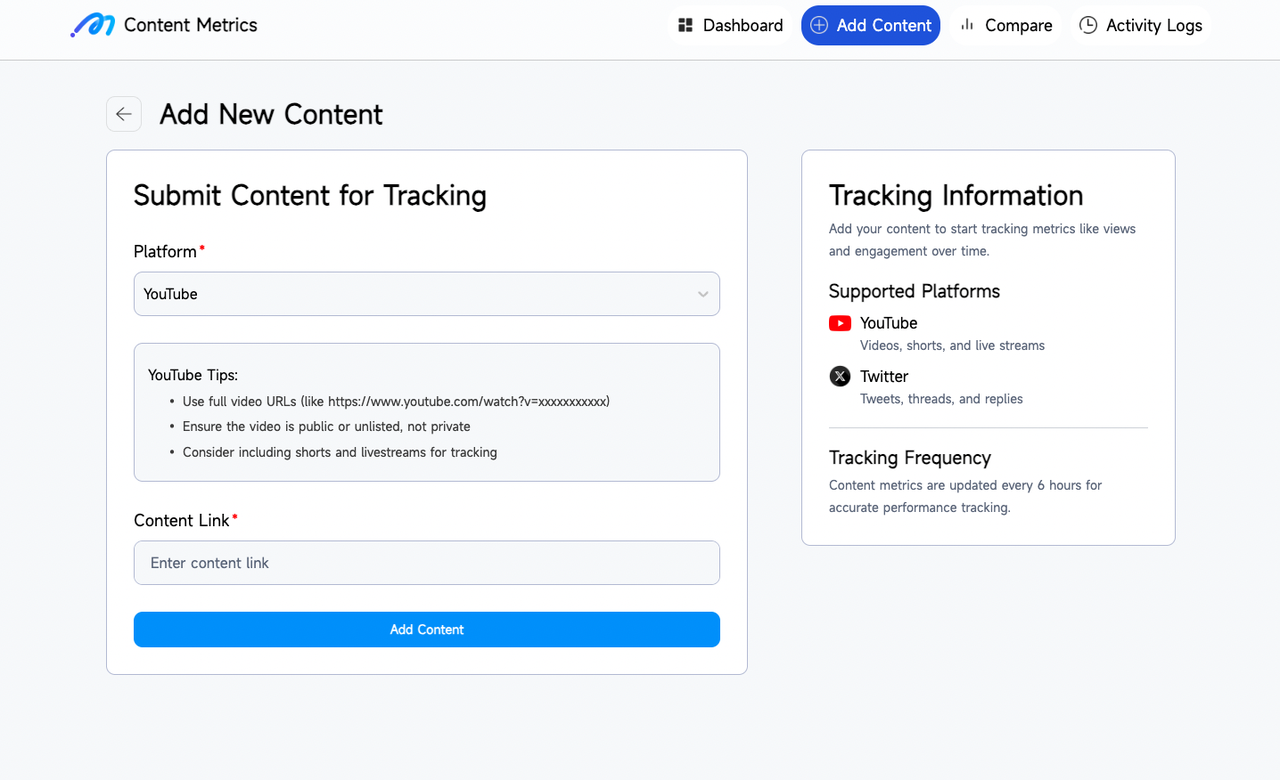
Simply get the content data by submitting the link
Easy to see the current and historical data of a content
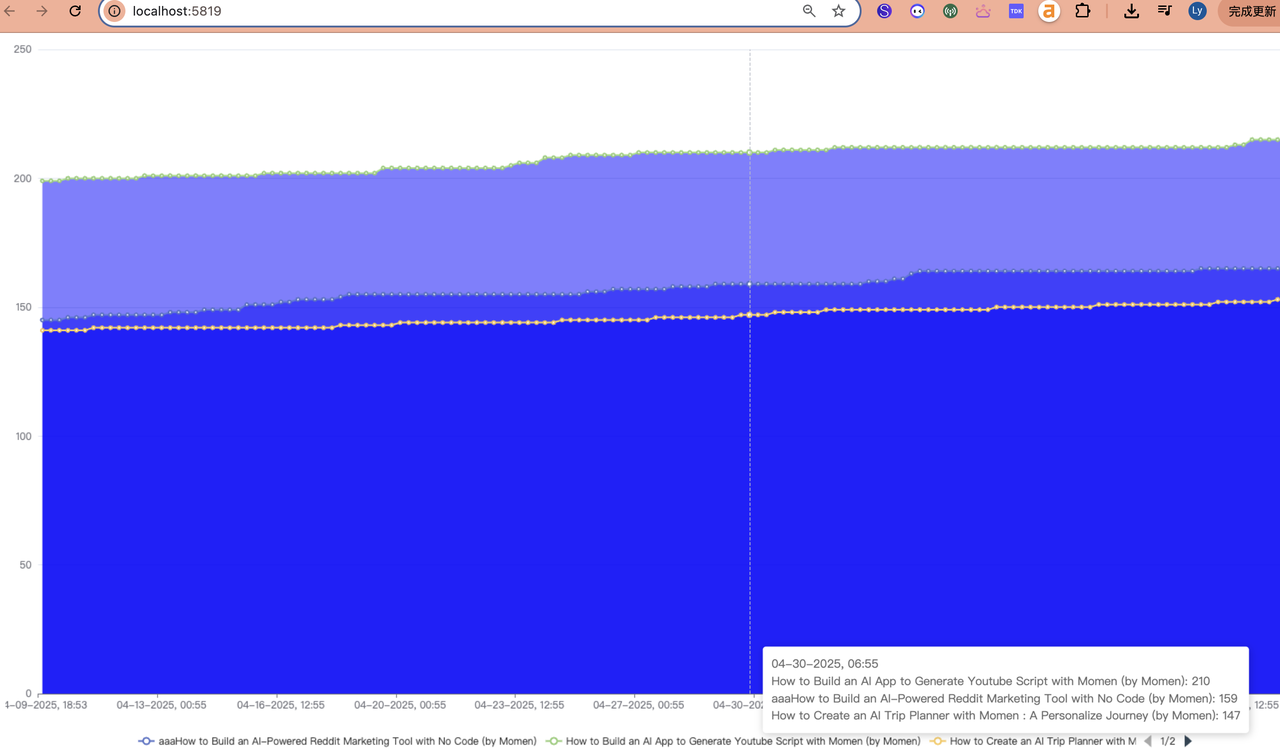
Easily to compare the data between content
The chart is more straightforward
Automated update and sending notifications
Making It Functional with Momen: How It's Built
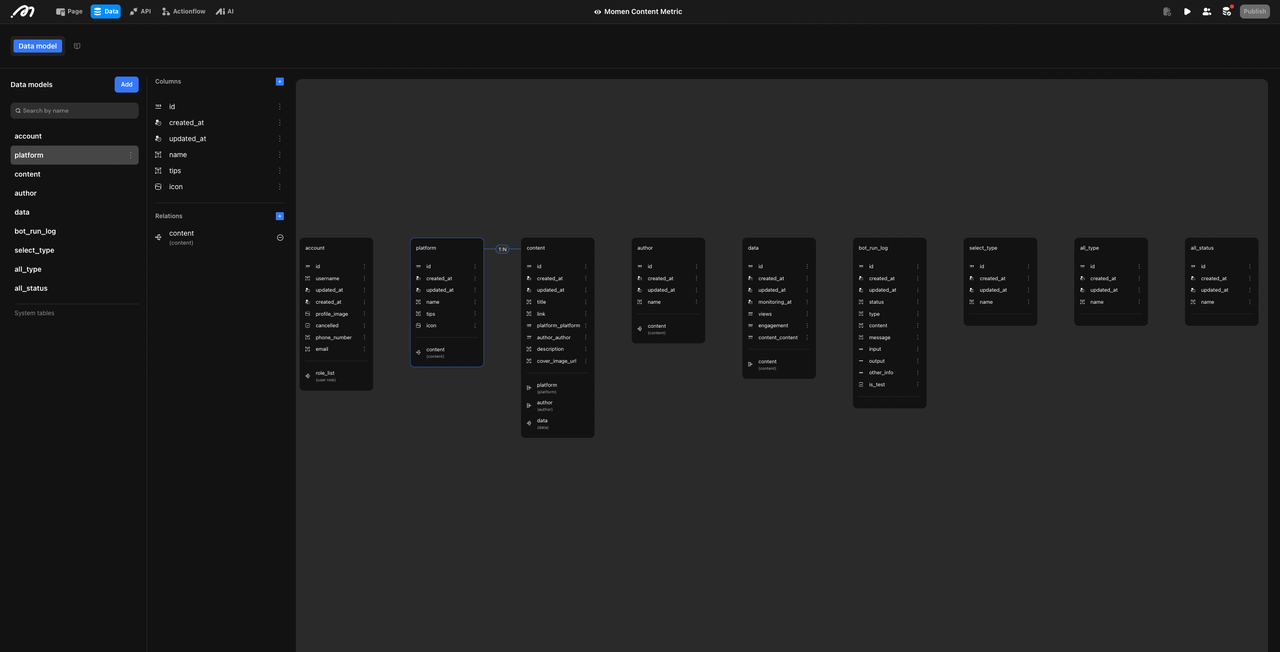
Data Model
First, we need to add the essential data tables to store the data we want to analyze.
Content: Stores the content details from Youtube and X, field including: title, link, description, image.
Platform: The content platform. Has 1:N relationship with the content, since we have multiple contents from one platform.
Data: Stores the data metrics of one content, fields including monitoring_at, views, engagement. Has 1:N relationship with content, because one content has different data metrics at different time.
Author: The author of a content.
bot_run_log, select_type, all_type, all_status: These four tables mainly store the log of the automation process.
Bridging No-Code with Code Components
One of the most powerful parts of this project was how we extended Momen’s no-code flexibility with custom code using Code Components. These are fully functional, self-contained React modules that integrate directly into Momen's visual editor — letting you build advanced UIs like dynamic charts while staying in a mostly no-code environment.
Most no-code platforms lock you out of actual code. Momen does the opposite: it gives you visual development by default, but with the option to drop into React code when needed.
What We Used It For
We wanted our content dashboard to feel like a real analytics tool — meaning rich charts and live comparisons. With Momen’s Code Components, we created a CompareChart module using React, embedded it inside our page, and connected it to our database using GraphQL.
This way, we got the flexibility of custom code while still managing app logic, data, and layout with no code.
Our Setup
Dev Tools: You can use any IDE like VS Code. We used Cursor, an AI-powered coding environment that helped us generate and edit React code with simple prompts.
Project Bootstrapping: Momen initializes each Code Component with a typical React project setup and some prebuilt examples like:
AddCalculator.tsxBar3DChart.tsxDemoChart.tsx
We started from these templates and built out our own CompareChart.
📌 You can find the full setup guide here: docs.momen.app/my-account-and-community/code-component
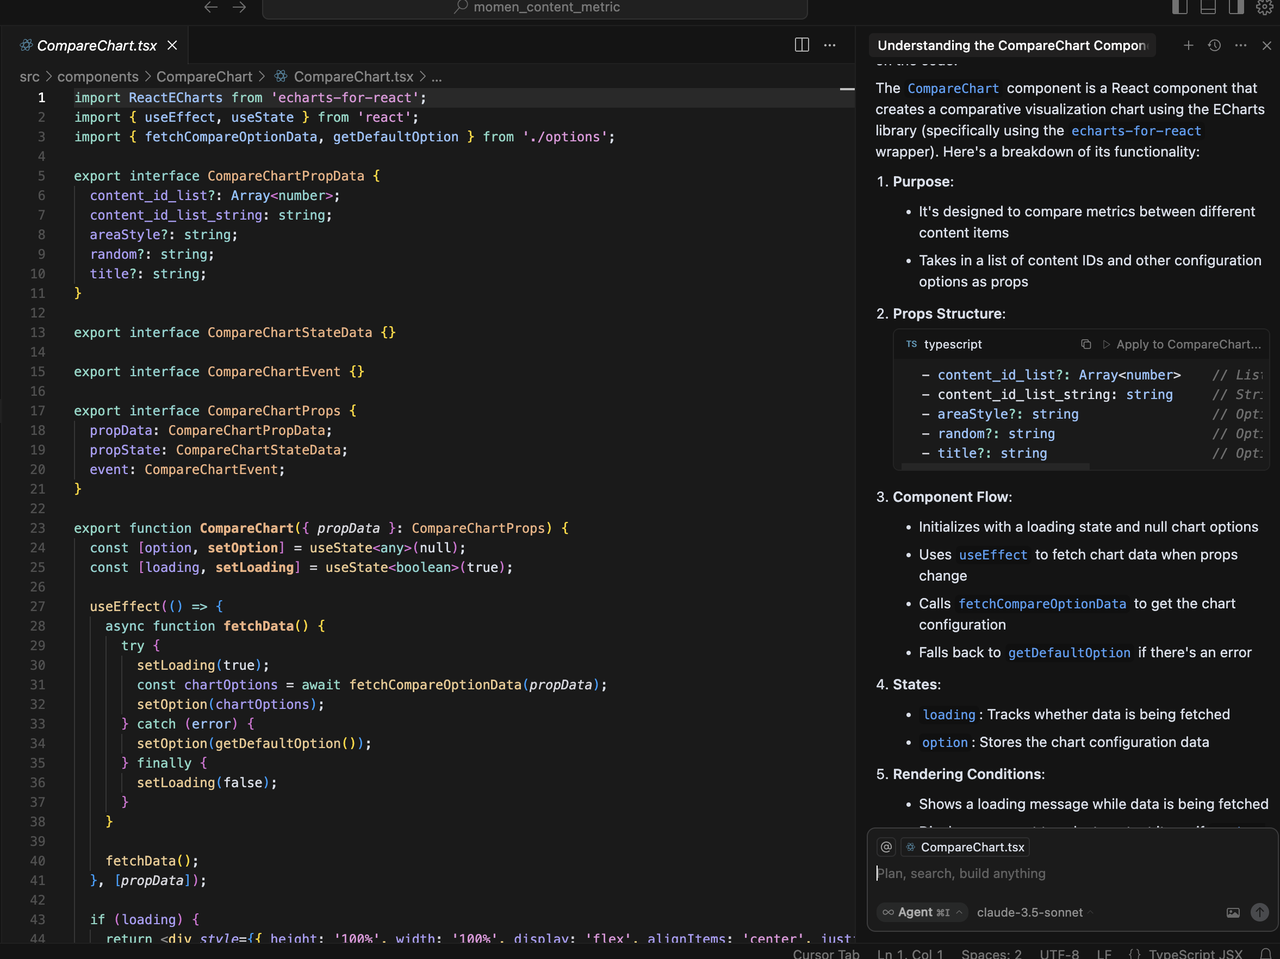
A Look at Our Chart Component
Here’s how our CompareChart works:
Inputs (via
propData):content_id_list: Which content pieces to compareareaStyle: Chart stylingtitle: Optional labelrandom: Toggle for mock data
Behavior:
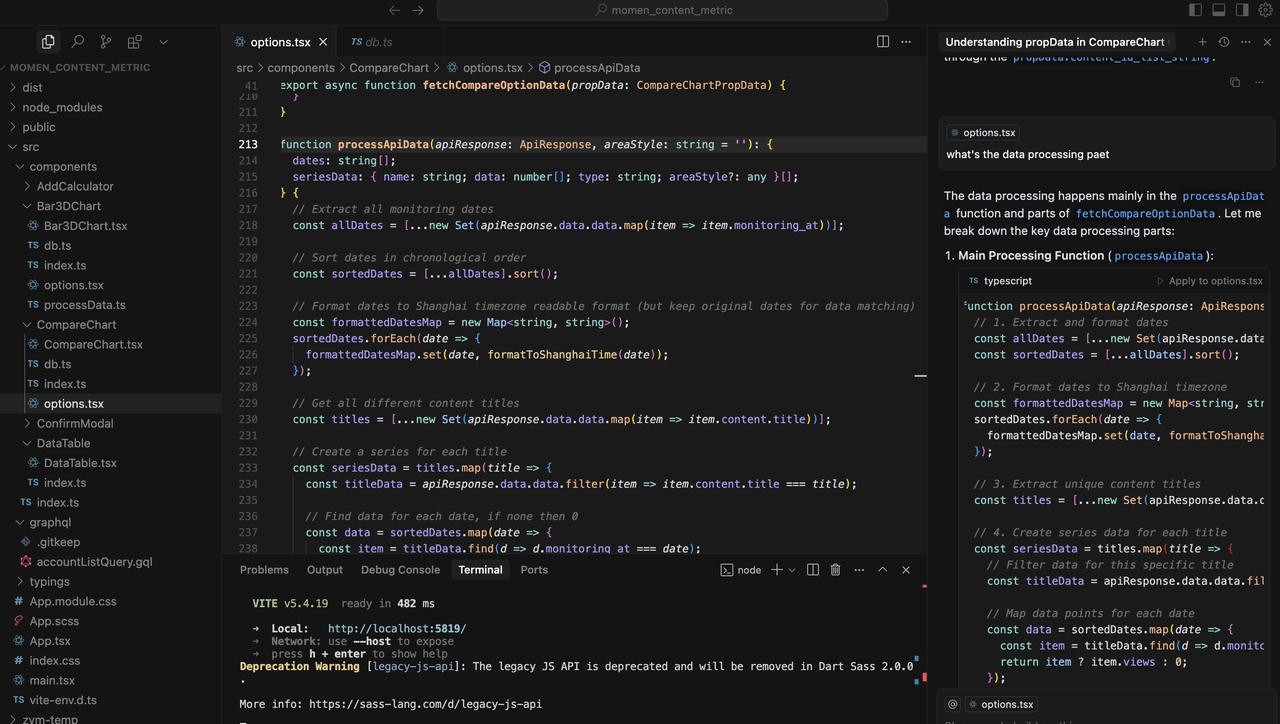
Fetches data from our backend via GraphQL (uses the
graphqlEndpoint(defined indb.ts).Processes results and renders the chart dynamically ( in
options.tsx).
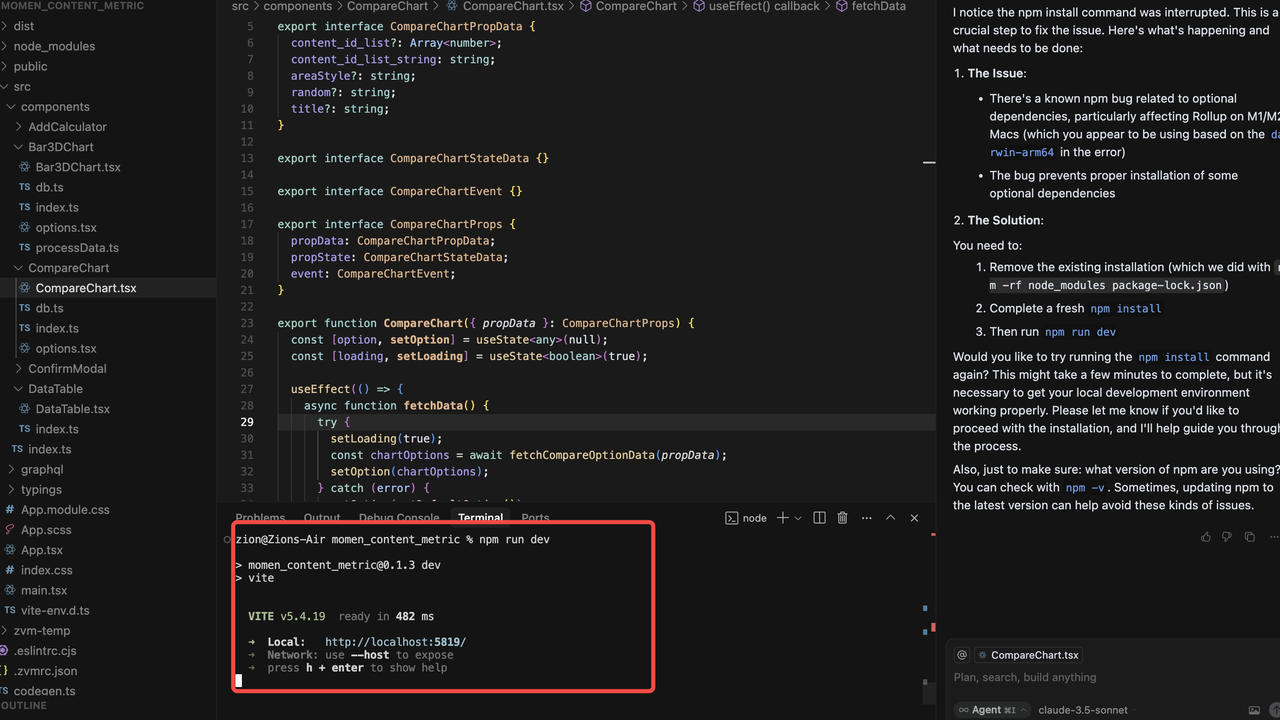
We used Cursor to write the React component conversationally — literally typing what we wanted and letting AI build or revise the code based on the templates we have. For marketers or PMs with minimal coding background, this was a huge productivity unlock.
After finishing the chart, we ran it locally with npm run dev to check the layout and functionality.
Importing Your Code Component into Momen
Once your React chart is ready, run momen publishto publish the project. Then add it in Momen:
In the Momen editor, navigate to the "Add Component" panel.
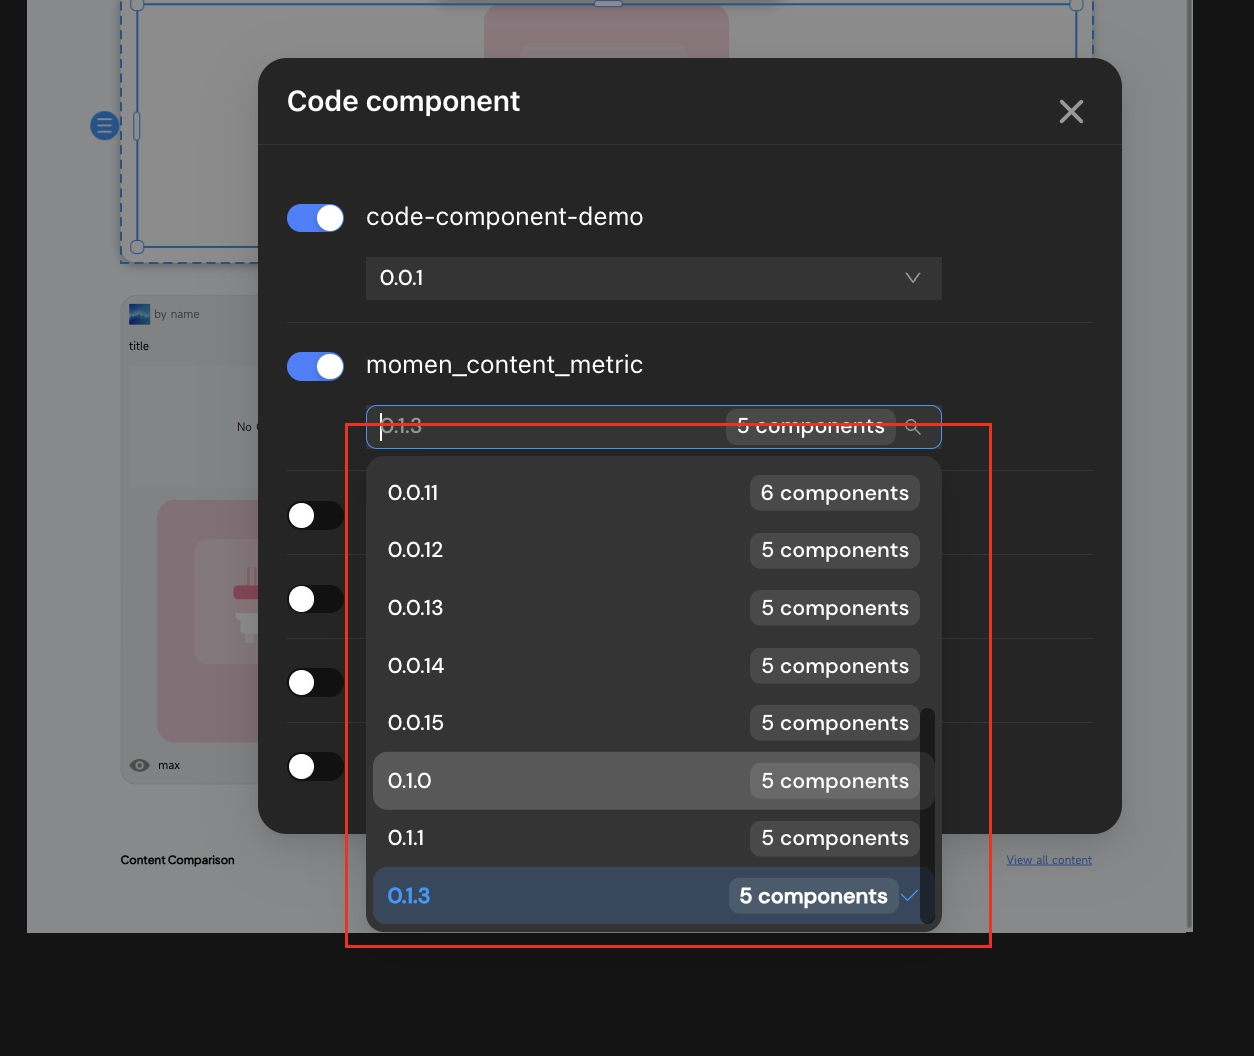
Switch to the "Code" tab. Here you'll find a list of your available Code Components.
Select the latest version, then your components will be imported.
Drag and drop the desired Code Component onto your canvas.
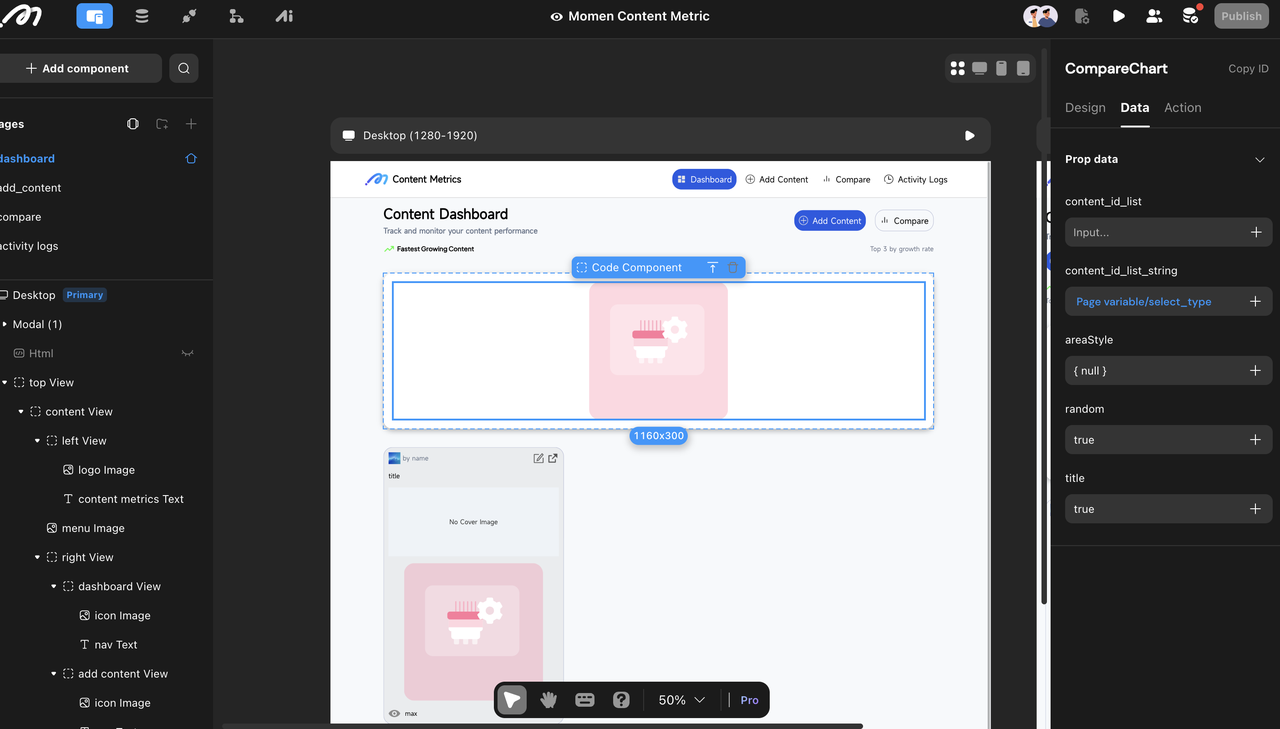
On the right sidebar, you’ll see the inputs (like content_id_list) ready to be connected to page variables or static values — just like any other Momen component.
Connecting It to Live Data
Now that the UI was in place, we connected the chart to our backend using Momen’s GraphQL API.
Step 1: Defining the GraphQL Endpoint
Within your Code Component's project (e.g., in a db.ts file), you can define the GraphQL endpoint for your Momen application. This URL typically includes your unique Momen app ID.
// Example: db.ts
export const graphqlEndpoint = "https://villa.momen.app/app/YOUR_APP_ID/api/graphql-v2";
Replace YOUR_APP_ID with your actual application ID.
Step 2: Fetch and Process Data
We used Cursor to write a fetch function to grab metric data for selected content.
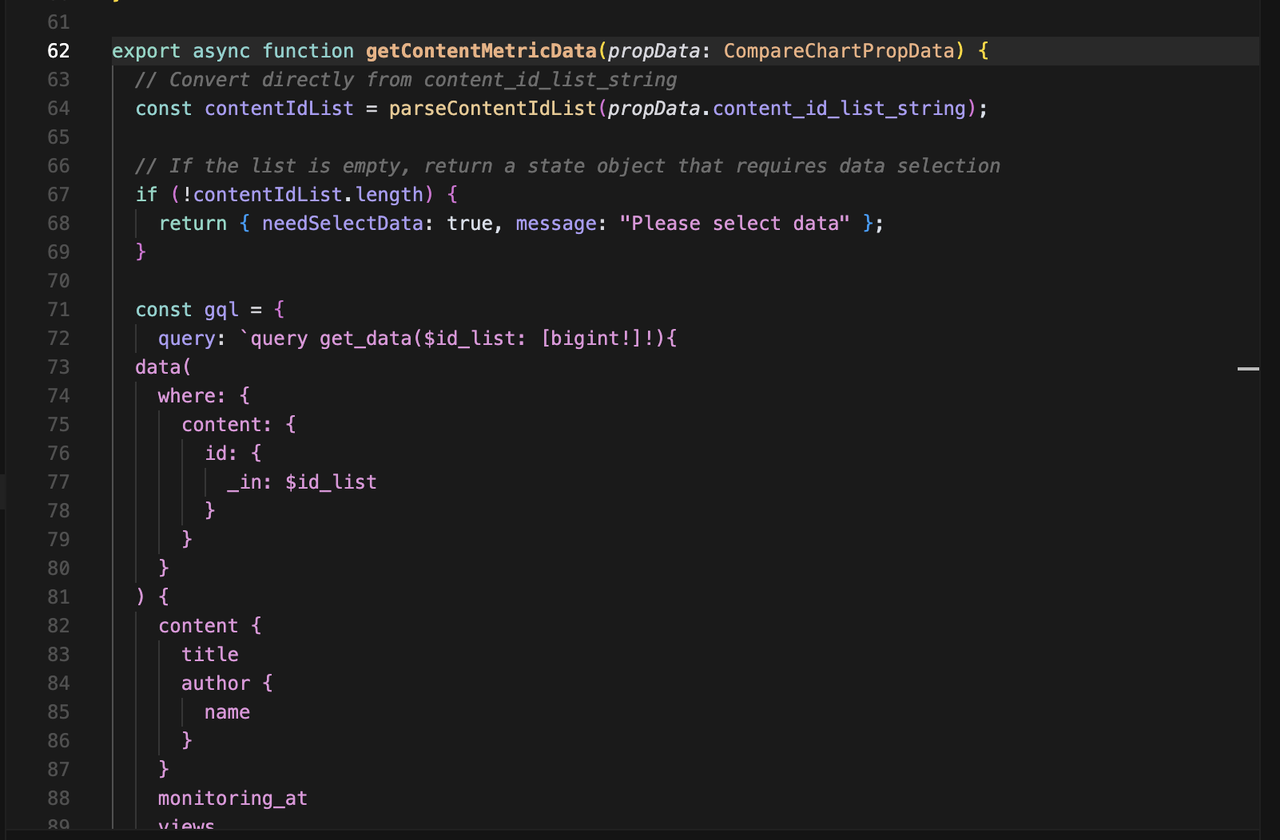
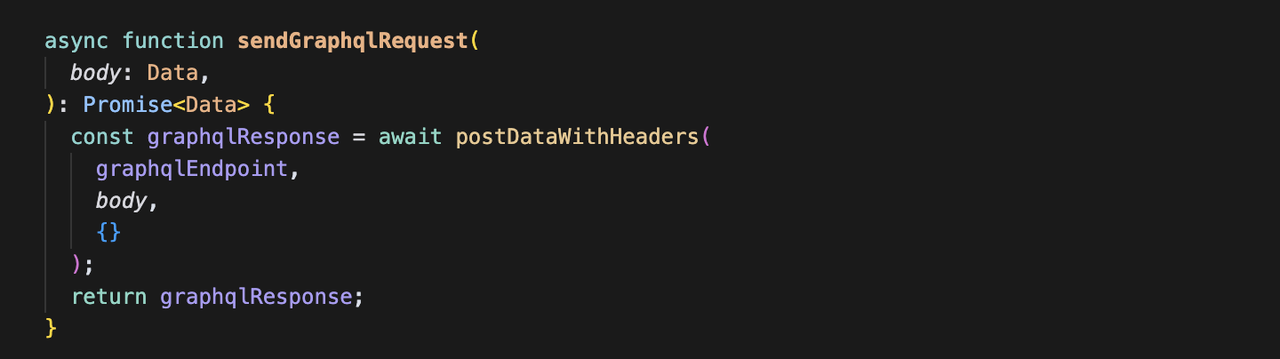
Then transformed it into chart-ready format using a utility called processApiData.
Once that was done, the chart displayed live data — fully integrated, no extra backend setup needed.
Why This Workflow Matters
This hybrid workflow — prompt-based UI design (Lovable), AI-assisted coding (Cursor), and no-code structure (Momen) — gave us the best of all worlds:
Fast prototyping
Full React flexibility when needed
Seamless integration with our visual backend
Momen was the glue that held it together — letting us move fast, stay visual, and still go deep technically when needed.
Automating Everything with Momen's Actionflow
In our dashboard, the user only submits a link on the frontend. Behind the scenes, Momen’s Actionflow handles everything: fetching the video details, updating metrics, and keeping the data fresh — all on autopilot.
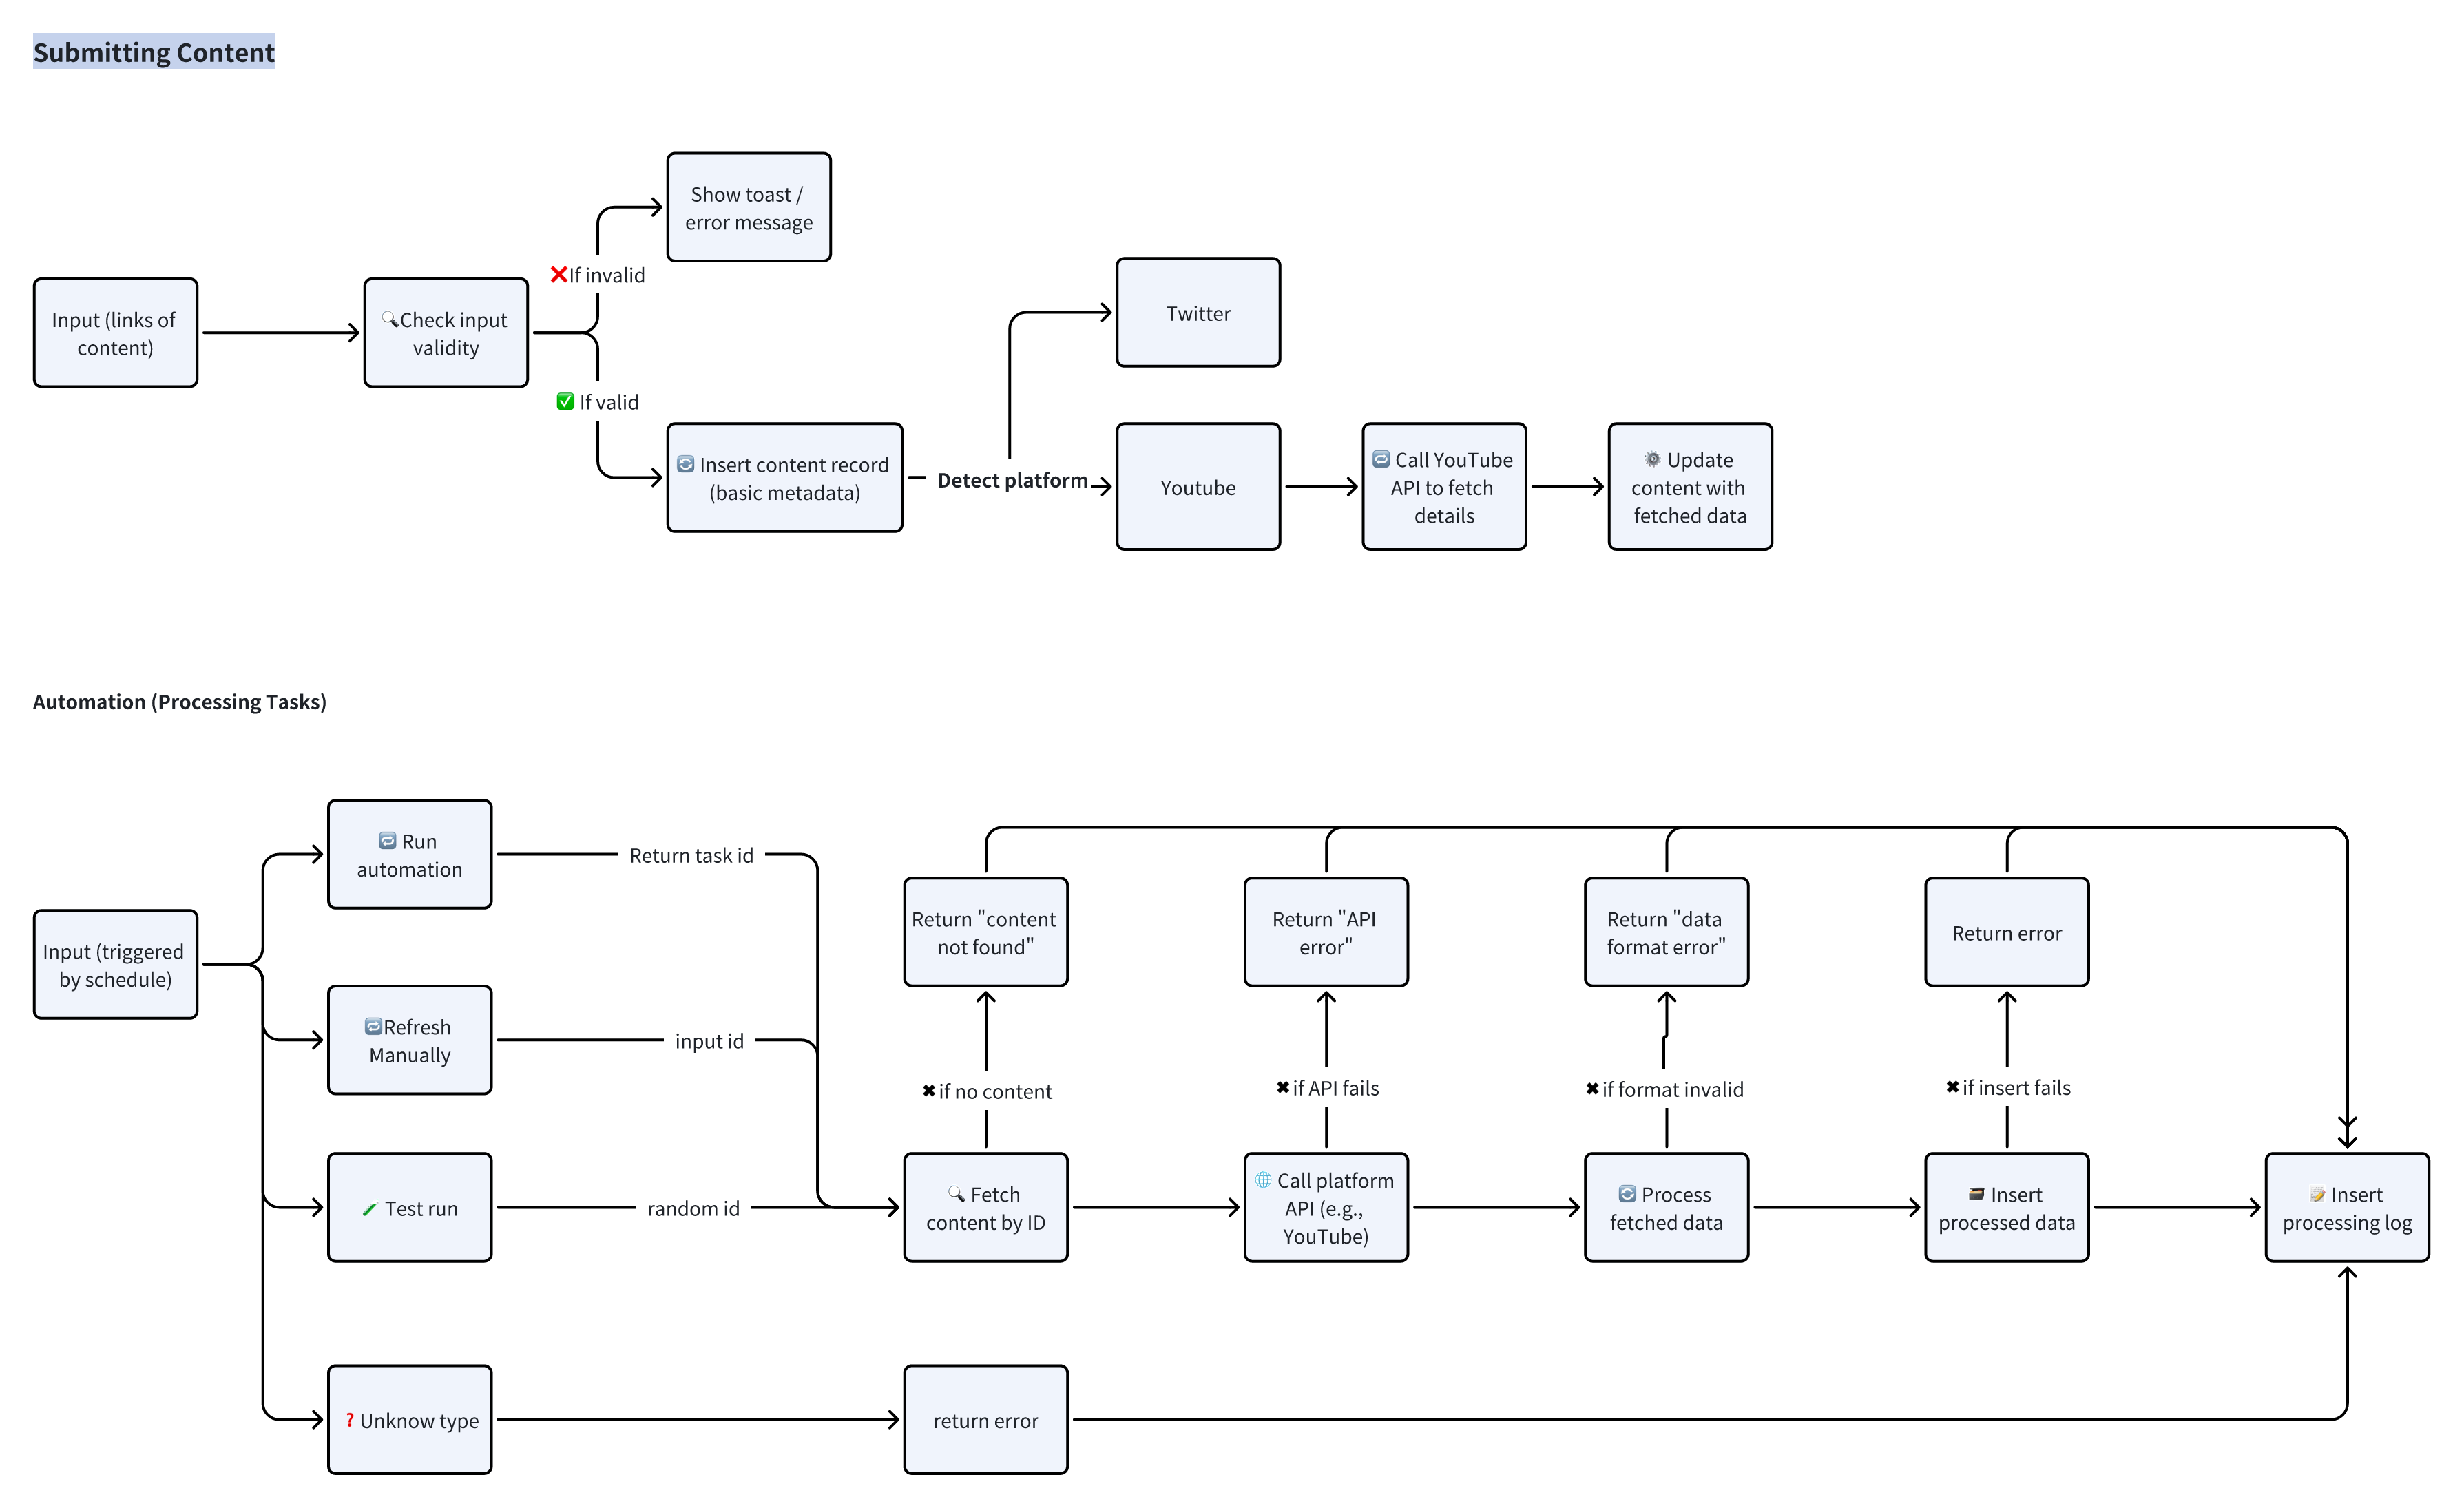
Frontend Flow: Submitting a Link
When a user pastes a YouTube link, an Actionflow is triggered immediately. If the link is valid, the system fetches video details and saves them to the database.
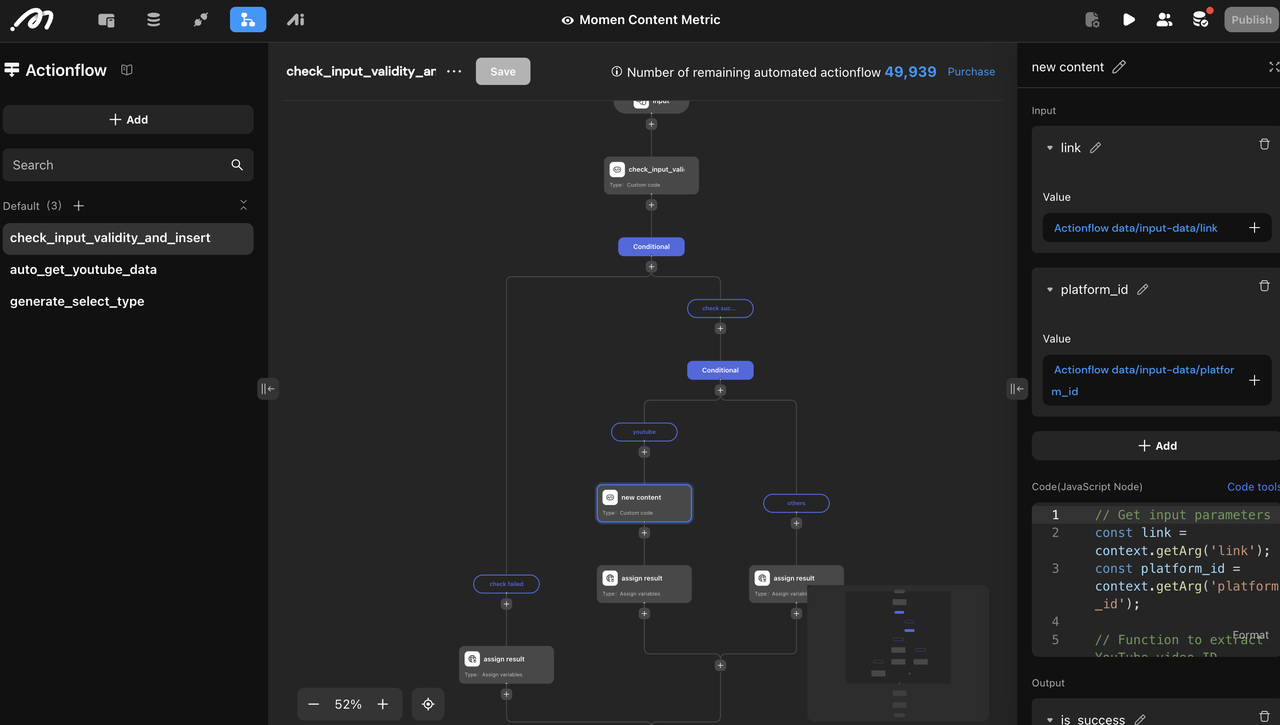
Here’s what happens step-by-step:
Receive Input The Actionflow collects the YouTube link and the platform ID (e.g. YouTube = 1).
Extract Video ID It parses the URL to get the video’s unique ID. If the link is invalid, the flow stops and shows an error.
Fetch Video Details The video ID is sent to the YouTube API to retrieve metadata like title, description, and channel name.
Insert or Find Author If the channel doesn’t exist in our database, it gets added automatically.
Insert Content Record With all the details collected, a new content entry is created in the
contenttable — including author, description, cover image, and platform info.Success or Error Message Finally, the Actionflow confirms whether the process succeeded or returns a clear error if something failed.
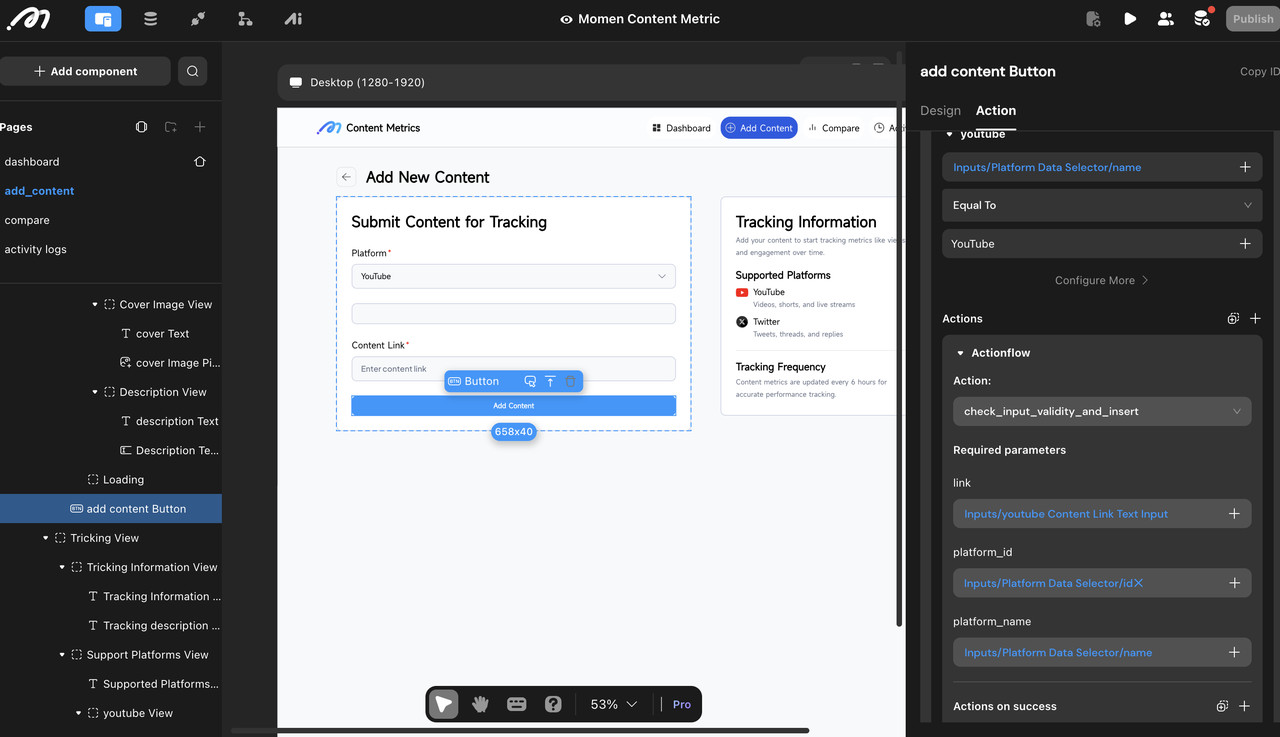
This is a one-time setup per link, making it super simple for team members to add new content for tracking.
Backend Flow: Scheduled Metric Updates
The second part of the system runs automatically — every 6 hours — to keep engagement metrics up to date. We configured this with the schedule 0 55 */6 * * ?, which means it triggers at 55 minutes past the hour, every 6 hours.
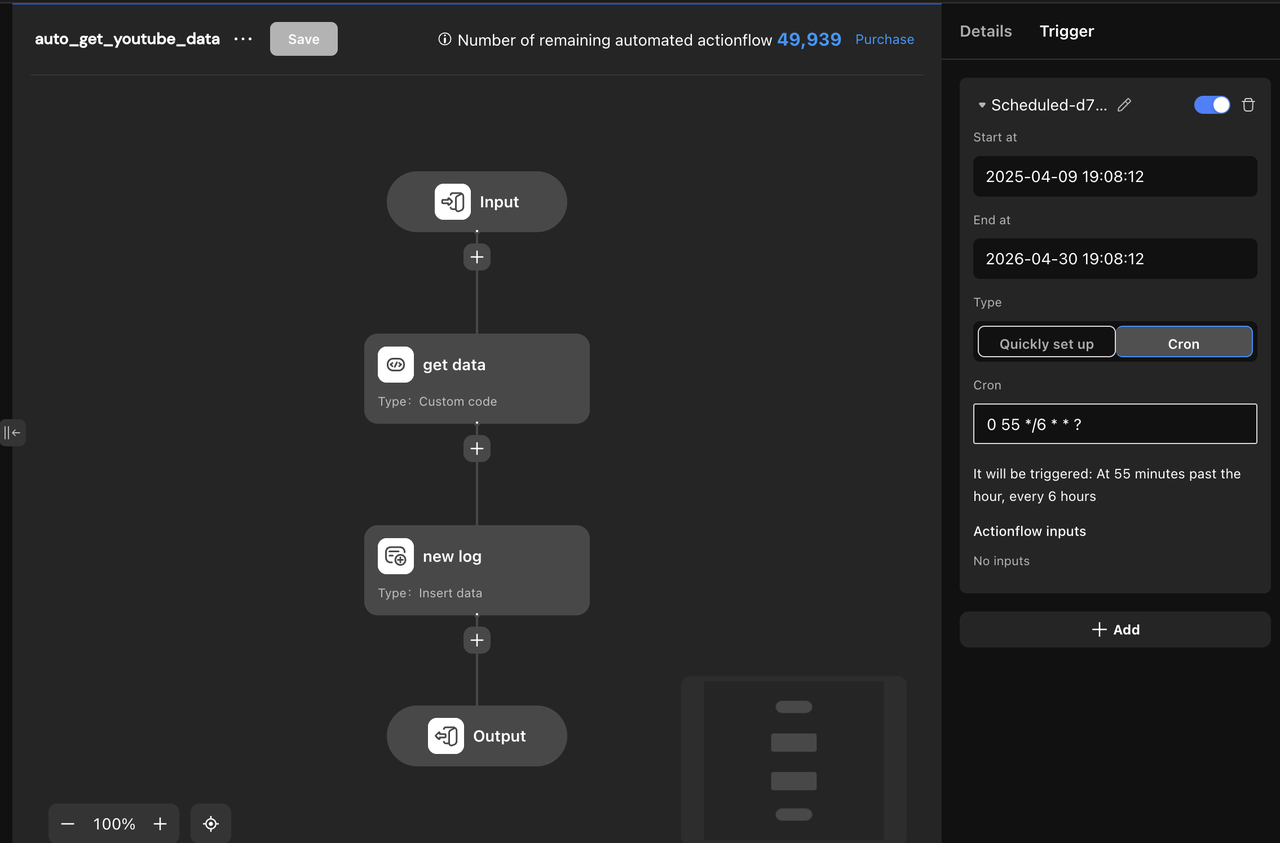
Here’s what the scheduled Actionflow does:
Fetch All Videos It queries the database for all content records from a specific platform (in our case, platform ID = 1 for YouTube).
Extract YouTube Video IDs From each content link, it pulls out the video ID required to request stats from the YouTube API.
Query YouTube for Engagement Data The API returns fresh stats for each video — including:
Views
Likes
Favorites
Comments
Process and Structure the Data For every video, the system:
Locates its corresponding content ID in the database
Calculates an engagement score (likes + comments + favorites)
Records the current timestamp (
monitoring_at)
Insert Updated Metrics This processed data is saved to the data table as a new record, preserving historical snapshots for trend tracking.
Error Handling If something goes wrong — like a missing video or an API issue — the Actionflow stops and logs a clear error message. If successful, it confirms how many new rows were inserted.
Insert Log Record Finally, it records the run status in a dedicated log table (
bot_run_log) so we can monitor the automation health over time.
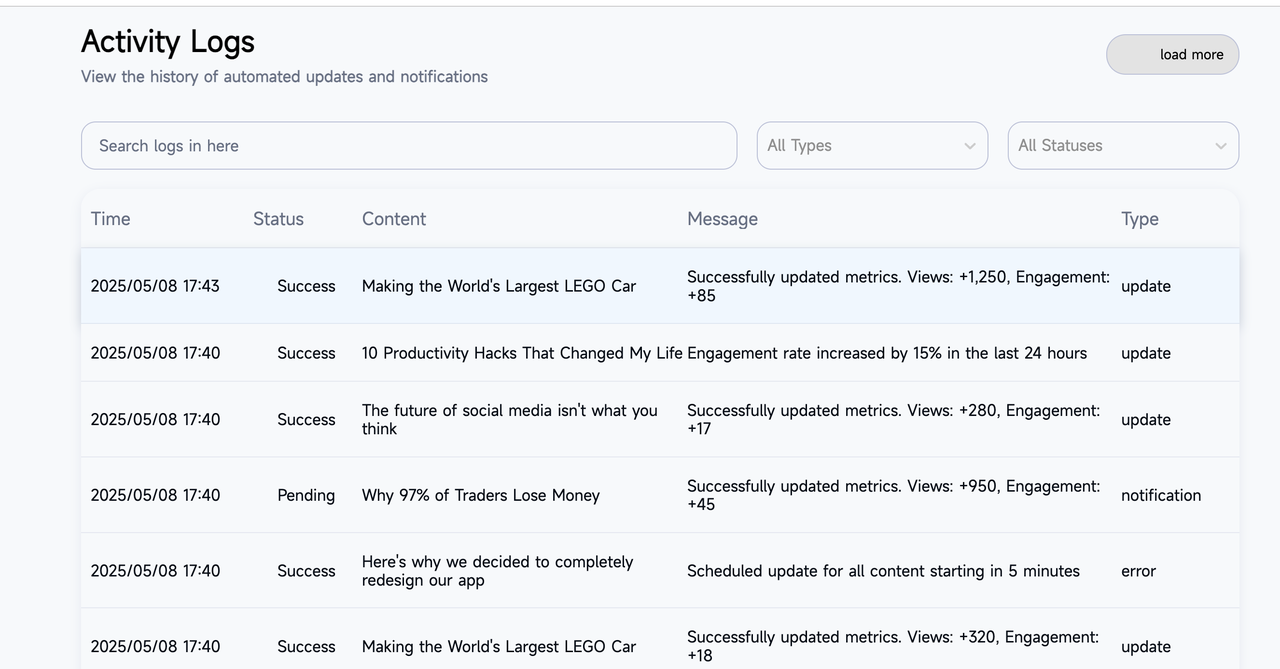
This scheduled setup makes sure the dashboard always reflects the latest numbers — without manual work. Paired with Momen’s Actionflow, it turns a simple content list into a living analytics tool.
Cost & Time: What It Took to Build
This entire dashboard took about 1 week to build — from sketching out the idea to launching a fully functional internal tool.
We built it using Momen's Basic plan ($39/month), and that was more than enough to support the data model, automation, and custom components. No additional servers, no complex setup.
If you’re a small team or solo builder, this setup is both cost-effective and fast to ship.
Final Thoughts: Flexibility Meets Control
Building this internal dashboard reminded us why we built Momen in the first place — to give teams like ours more control, without forcing them to choose between code or no-code. With Momen, we were able to move fast, automate the backend, and even drop in fully custom React components when we needed more flexibility — all in one place.
Tools like Lovable and Cursor helped us get started, but Momen tied everything together. It let us combine AI-generated UI, custom code, and no-code automation into a single, coherent product — without needing a dedicated dev team.
If you're working on a side project, building a startup MVP, or just trying to automate an internal process, we hope this shows what’s possible. The no-code builder doesn’t have to be a sandbox. With Momen, it can be a launchpad.
FAQ
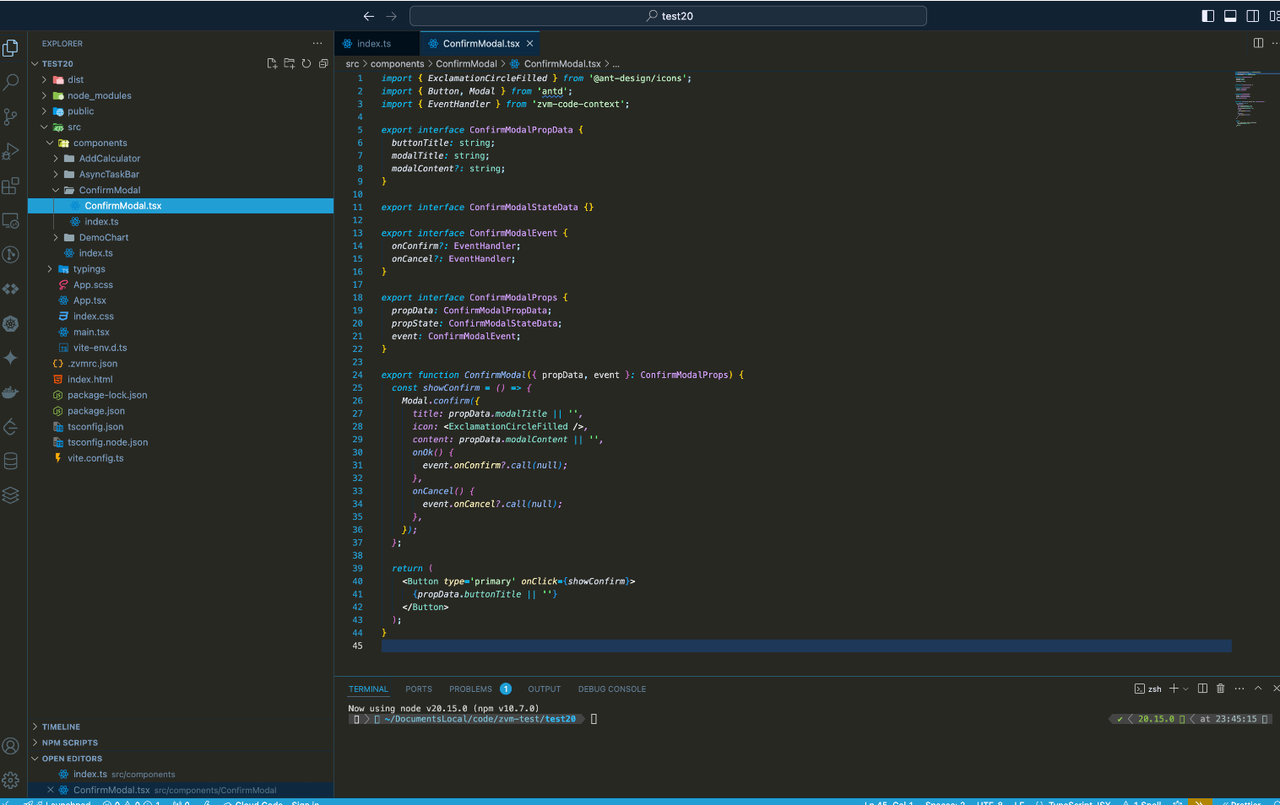
Q1: What are Momen Code Components at their core?
A1: They are essentially self-contained React projects. This allows you to write custom JSX, utilize React hooks, manage state, and integrate third-party React libraries within a component that can then be used in your Momen app.
Q2: How do Code Components receive data from Momen?
A2: Code Components receive data through a propData interface defined in their TSX file. When you use the component in the Momen editor, these propData fields appear in the "Data" tab of the component's settings, where you can bind them to Momen page variables, static values, or other data sources.
Q3: How can Code Components trigger actions or send data back to Momen?
A3: By defining an event interface in their TSX file. These events (e.g., onConfirm, onClick) become available in the "Action" tab of the Code Component in the Momen editor. You can then link these events to Momen's Action Flows, enabling your custom component to initiate Momen-side logic.
Q4: Can Code Components fetch data from Momen's database or external APIs?
A4: Yes. Since they are React projects, they can use standard JavaScript fetch or libraries like Axios to make API calls. For Momen's database, they can query the app-specific GraphQL endpoint.
Q5: How is the code for a Code Component managed and deployed?
A5: You develop the React code in your local IDE. Momen provides a way to sync or upload this codebase. When your Momen app is used, the Code Component is rendered as part of the Momen page, with data flowing via propData and actions via event handlers.